How to use Piktochart to create an infographic
Design and create graphics without intensive experience.

If you’ve ever used a platform like Canva to make infographics, you may have noticed it often comes at a price. But here is Piktochart, an online infographic application that allows users without graphic experience to easily create professional-grade infographics using themed templates for free.
Trusted by 11 million users, Piktochart is fast, easy, and packed with features that make it simple to create data and visuals.
In this article, you will learn to create and customize watermark-free infographics in minutes.
Steps to create an infographic using Piktochart
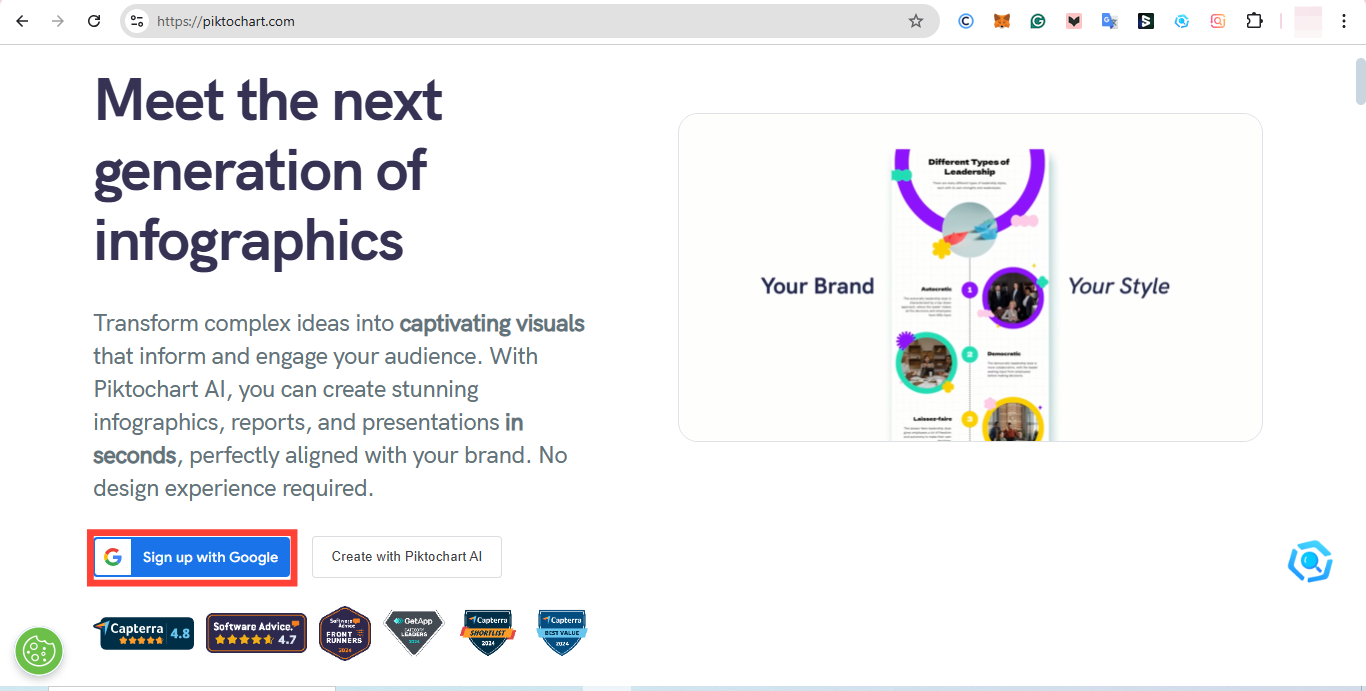
Step 1: Sign Up or Log In to Piktochart
Go to Piktochart's website and sign up. Once logged in, you can access your projects, templates, and editing tools.


